| MAIN |
| ABOUT A PROJECT |
| OBJECTIVES |
| TEST REGIONS |
| DATA BASES |
| STUDY RESULTS |
| REPORTS |
| CONTACTS |
TASK 2: CREATION OF NOAA-AVHRR DATA ARCHIVE
The main task of this part of our research was to prepare a uniform set of data received from the AVHRR radiometers of NOAA satellites. The volume, temporal and spatial scales, and specifically the correctness of this data set should correspond to the tasks of the project of the continental-scale mapping and monitoring of Russian forests. The following steps were planned to fulfill the above goal:
- To collect the NOAA-AVHRR data at the receiving stations;
- To pre-process the NOAA-AVHRR data;
- To design the NOAA-AVHRR database and to develop data access software.
These sub-tasks were implemented by the Space Research Institute RAS (IKI RAS, Moscow) according to the methodology approved by the International Forest Institute in cooperation with the Institute of Solar-Terrestrial Physics SB RAS (ISTP SB RAS, Irkutsk) and the Institute of Space Physics Researches and Aeronomy SB RAS (ISPRA SB RAS, Yakutsk).
Collection of raw data from NOAA-AVHRR receiving stations (Moscow, Irkutsk, and Yakutsk)
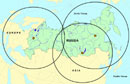
NOAA-AVHRR data collection was organized at three data receiving stations located in Moscow, Irkutsk, and Yakutsk. These stations were selected to provide full coverage of Russian territory by the satellite data (pic1). In order to ensure the consistency of data sets collected, uniform software was installed at all the stations and data retrieving manual was prepared. Data collection was organized from April to October 1999 to cover a vegetation period of Russian forests at the maximal extent. Basing on a fact that the daylight satellite data are more suitable for the tasks of forest mapping and forest wildfire detection, and because of the technical limitations on the volume of information storage, all the available daylight imagery from NOAA-14 satellite was included into the data sets. The data received were exported into the L1F format (http://smis.iki.rssi.ru/data/l1f.txt) and archived to the CD-ROMs. The total volume of the row data collected at each of the receiving stations was about 25 Gb.
The International Forest Institute organized a similar NOAA-AVHRR data collection activity in 1998 outside of the framework of the current project.
At the end of the 1999 vegetation period, after the satellite data collection at the receiving station was completed, these data, along with the data from 1998, were transferred to IKI RAS for pre-processing and data archiving in a user-friendly form.
Pre-processing of NOAA-AVHRR data
Pre-processing included the following tasks:
- Verification of data sets completeness and monitoring of retrieving and collection procedures' correctness;
- Elimination of data redundancy due to the overlapping of receiving zones of different stations;
- Elimination of high noise pixels from the images and filtration of impulse noise;
- Correction of deviation of the satellite orbital parameters at the survey time with using the reference map;
- The assessment of cloudiness at the session time;
- Exporting of the imagery into the uniform Level 1B standard format;
- Archiving of the data sets to the external data storage and transferring the data to the International Forest Institute.
The following procedures were developed to satisfy each of the subtasks mentioned above.
Verification of data sets completeness and monitoring of the correctness of retrieving and collection procedures.
Verification of data completeness was performed at the time the data were received for pre-processing. We checked the correctness of data records and the complete matching of the recorded data to an earlier defined format. We checked for the two possible defects: writing errors during data archiving to the magnetic storage devices and absence in the data of the calibration information due to faults of data receiving software.
Elimination of data redundancy due to overlapping of receiving zones of different stations.
Major data overlapping occurs during data receiving at Irkutsk and Yakutsk receiving stations. The analysis performed has shown that probability of full data overlapping is quite low (10 - 15%). Due to the fact that the high noise parts of the received at both stations imagery usually relate to the different territories, we decided not to exclude these overlapping regions to enhance the noise resistance of the archive developed.
Correction of deviation of the satellite orbital parameters at the survey time with using the reference map
The geometric correction based on the satellite orbital model alone can not provide suitable level of accuracy necessary for multi-temporal analysis of time series of NOAA imagery. Because of that, we have developed and programmed an algorithm of enhanced geometric correction. The algorithm provides an enhanced accuracy of geometric co-registration of the images surveyed at different time by searching for the maximum of correlation between the images and the water mask derived from the Digital Chart of the World (DCW) and the World Vector Shoreline (WVS) data sets.
The procedure of geometric correction enhancement consists of the following steps:
- Automatic search of test plots occupied by the shorelines of oceans, seas, lakes and large rivers;
- Sampling of imagery fragments correspondent to the identified plots;
- Geographical projection of the images;
- Finding the correlation between the images and the test mask of the water objects;
- Calculation of deviation of image coordinates and correction of satellite orbital parameters;
- Correction of satellite orbital parameters in raw satellite data.
Elimination of high noise parts from the imagery and filtration of impulse noise.
The reason of high noise in initial and final parts of NOAA images is connected with the adjustment of equipment at the start of receiving session and during installation of connection with the satellite, and also with satellite positioning near the horizon, at the edge of station visibility.
The following procedures have been worked out to eliminate this type of noise, including also impulse noise:
- Elimination of the initial and final parts of images that represent highly noisy signals. The image analysis was performed using the 50-rows fragments. A processed fragment was excluded from the image if more than 50% of fault rows had been found. A "bad row" marker was put at the step of synchronization, time, and heat sensor testing, performed during the receiving session.
- Elimination of a group of bad rows. If a single or even a group of bad rows were found during the middle of the session, meaning that all preliminary tests failed, the rows were nullified. During this procedure, a special quality marker (flag), which belonged to the L1B standard set of symbols, was set.
- Elimination of impulse noise was done for each of the rows according to the following procedure. The central pixel of a 3x1 window was compared with its neighborhood. If a deviation of this pixel was found to exceed a certain boundary, its value was checked in all five channels. If the irregularity was found in all the channels, it was assumed not to be the noise. Contrary to this if the irregularity was found in the processed channel alone, the value of a central pixel was corrected by finding the average of the two neighboring pixels of the row.
To save the fires information, the "cold" pulses were only registered in the 3rd channel. We also used this procedure to perform an additional control of bad rows. If the percentage of the noisy pixels exceeded 30%, the rows were filled with zeros, and each row was marked with a bad row code.
Exporting of the imagery into the uniform Level 1B standard format.
After the geometric correction and noise filtration had been completed, the data were exported into the Level 1B format. All the prerequisite format parameters that were not included into the initial data were calculated during this step. From the data, exported into Level 1B, quick-look images were generated and saved into a catalog.
The assessment of cloud coverage at the session time
We used the algorithm described in (Larry L. Stowe, Pual A. Devis, E. Paul McClain. Scientific Basis and Initial Evaluation of the CLAVR-1 Global Clear/Cloud Classification Algorithm for the AVHRR. Resubmitted to Journal of Atmospheric and Oceanic Technology. May 1, 1998) to calculate the percentage of clouds in NOAA images.
The following cloud classification rules were assumed to be the most significant:
- Albedo value is less than 40%;
- Difference between the maximal and minimum albedo in a 4x4 window exceeds 9%;
- Difference between the albedo of the 2nd and 1st channels lays between 0.9 to 1.1;
- Difference between the maximal and minimum brightness temperature in a 4x4 window of the 4th channel exceeds 3K;
- Brightness temperature is less than 249K.
We generated the clear/cloud mask, using the above algorithm. The values of "cloud" pixels were set to 255 and the other pixels were set to the brightness values of the 2nd channel. Then, the generated clear/cloud mask was transformed into a geographical projection and archived.
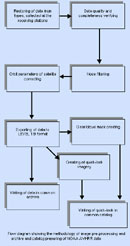
The scheme in pic. 2 illustrates the process of NOAA-AVHRR data processing with further addition to the catalog and archive. Archiving of the data sets to the external data storage and transferring the data to the International Forest Institute.
We used the Seagate STD6240000N device to backup the data in L1B format to 4mm magnetic tape DDS-3. The cycle of data pre-processing and archiving took about 1,5 days per one tape (12 Gb).
NOAA-AVHRR database: structure and toll to access
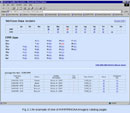
We developed a catalog, which contains information describing all pre-processed 1998 and 1999 data. Our purpose was to provide fast tape file search and real-time processing of AVHRR/NOAA archive. The catalog was generated in HTML format and can be browsed by widely available Internet Explorer and Netscape Communicator. The catalog stores image data in relational tables and allows quick-looks (fig. 2.3).
A catalog page is splinted horizontally into two parts. The top part provides information about the total number of stored images for each month of 1998 and 1999 years. Also it shows a calendar with the number of stored AVHRR/NOAA images for each day.
Information in the top window is dynamically linked with a table in the bottom window. The latter shows the main technical characteristics of stored images (pic.3). These include the date and time (GMT) of image storing, a flag showing advanced geometric image correction, number of tape, number of data set, references to quick-look and image of cloudiness. We can access to AVHRR catalog via INTERNET by following address:
http://d902.iki.rssi.ru/data/sibtrees/html/catalog.shtml
Each image is stored in a tape in a separate file. File name is composed of the second digit of satellite number and of the last four digits of revolution number. A catalog user should set these parameters before searching for a file storing an image in the archived tapes.
TASK 3: PRE-FEASIBILITY STUDY FOR CONTINENTAL MAPPING OF RUSSIAN FORESTS USING COARSE RESOLUTION SATELLITE DATA (SPOT4-VEGETATION AND NOAA-AVHRR)
For our research of continental forest mapping, we have used the data received from VEGETATION sensor of SPOT4 satellite and from NOAA-AVHRR radiometer.SPOT4/VEGETATION satellite data
The SPOT4/VEGETATION data for the initial step of our research have been received from GVM/SAI in a form of a set of 10-days synthesized images that represented different seasons (product S10). These data cover the whole territory of Russia. The images received from GVM/SAI up to this date are listed in Table
SPOT4/VEGETATION data (product S10) for the territory of Russia.
| File name | Year | Month | 10-days period | Spectrum channels | Auxiliary data |
| SG80601.IMG | 1998 | June | 1 | 2-4 | No |
| SG90501.IMG | 1999 | May | 1 | 0-4 | No |
| SG90511.IMG | 1999 | May | 2 | 0-4 | No |
| SG90521.IMG | 1999 | May | 3 | 0-4 | No |
| SG90601.IMG | 1999 | June | 1 | 2-4 | No |
| SG90711.IMG | 1999 | July | 2 | 0-4+NDVI | No |
| SG90721.IMG | 1999 | July | 3 | 0-4+NDVI | No |
| SG90801.IMG | 1999 | August | 1 | 0-4 | Yes |
| SG90811.IMG | 1999 | August | 2 | 0-4 | Yes |
| SG90821.IMG | 1999 | August | 3 | 0-4 | Yes |
The product S10 contains the images that have been generated by selecting the 10-days maximum of NDVI. It includes the reflectance values measured in four spectral channels, with the effect of the atmosphere corrected using the model SMAC. The S10 product additionally includes the information (auxiliary data) about geometry and time of acquisition (solar zenith and azimuth angles, viewing zenith and azimuth angles).
A preliminary analysis of S10 products has shown the following features of the images received:
- Significant influence of geometry of acquisition on the brightness of the objects measured (BRDF effect);
- Existence of pixels or parts of images not-free from clouds;
- Existence of noisy pixels in the middle infrared channel due to sensor fault.
AVHRR/NOAA satellite data We have used the images produced by Irkutsk receiving station during vegetation season of 1998 to study spectral signatures of the lands, covered and non-covered by forests. For this purpose we selected manually thirty of NOAA-AVHRR images received in different time of vegetation period from May till September, in such a way that clouds covered not more than 10% of an image. The images were transformed into a geographical coordinate system with average accuracy of 1.0 - 1.5 pixels.
From the complete set of AVHRR images we selected the images from August 1998 to assess the separability, using the spectral signatures, of various categories of forested and un-forested lands, as compared to VEGETATION/SPOT4 data.
Ground data
We have used the forest fund database of Usolsky forest enterprise (Usolsk leskhos) to extract the base data for identification of different categories of forested and un-forested lands on low-resolution images. The database is described in the sub-task of regional mapping.
During the interim project period, we collected maps of some leskhoses located in different forest zones of Krasnoyarsk kray. Table 4.2 lists of the leskhoses chosen for further accuracy assessment of continental forest mapping using low-resolution data.
The list of forest enterprises chosen to control the accuracy of continental-level forest mapping using the low-resolution data.
|
ą |
Forest enterprise |
Year of survey |
Hard copies* |
Digital maps |
Ecoregion |
|
1 |
Taimyrsky |
1989 |
+ |
- |
Putoran-Anabar sparse taiga |
|
2 |
Evenkiisky |
1997 |
+ |
- |
Putoran mountain northern taiga |
|
3 |
Nizhne-Eniseisky |
1997 |
+ |
Partly |
Tunguss middle taiga |
|
4 |
Tchunoyarsky Usolsky |
1997 1993 |
+ - |
+ + |
Angara southern taiga |
|
5 |
Kozulsky |
1991 |
+ + |
- |
Kansk–Achinsk forest steppe |
|
6 |
Kizirsky Mansky |
1998 1998 |
+ - |
- + |
Sajan mountain middle taiga |
|
7 |
Khakassky |
1993 |
+ |
- |
Khakass mountain southern taiga |
|
8 |
Todzhinsky |
1988 |
+ |
- |
Sayano-Tuvinsk mountain southern taiga |
|
9 |
Tchedansky |
1997 |
+ |
- |
Tuva mountain forest steppe |
|
* "+" – data collected, "-" – no data. |
|||||
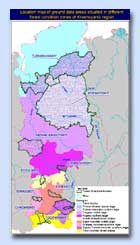
The map in Pic.4 shows the positions of control leskhoses of Krasnoyarsk region, which are located in different forest zones.
At this time we are transforming the hard copies of the forest maps to grids and registering them with SPOT-VEGETATION images.
TASK 4: DETECTION AND MAPPING OF ACTIVE FIRE DURING SUMMER 1998 OVER THE FAR EAST RUSSIAN REGION USING NOAA-AVHRR DATA
To make the research and experiments on detection of Far East wildfires, we have used the sets of NOAA-14 satellite images that were collected by Yakutsk receiving station during the 1998 fire season. We have given preference to this station after its data was compared with the data from Yakutsk receiving station. The latter was found to have less noise in the satellite images. Totally, 171 images have been used for the experiment on fire hot spots detection.The results of fire detection have been compared with reports of airborne forest fire protection service "Avialesookhrana". To test the results found, the following data have been used for each fire:
- Geographical coordinates of the place of fire detection;
- Date and time of fire detection;
- Area (forested and not forested) at the time of detection;
- Date and time of fire extinguishing;
- Area (forested and not forested) at the time of fire extinguishing.
| Number | Granule | Data | Time | Center Point |
| 1 | SC:L70RWRS.002:2000097638 | 06 Jul 1999 | 04:39:19 | 55.91° Lat, 93.68° Lon |
| 2 | SC:L70RWRS.002:2000105263 | 04 Jul 1999 | 1:35:29 | 50.28° Lat, 137.34° Lon |
| 3 | SC:L70RWRS.002:2000105254 | 04 Jul 1999 | 1:35:05 | 51.69° Lat, 137.95° Lon |
| 4 | SC:L70RWRS.002:2000105259 | 04 Jul 1999 | 53.10° Lat, 138.61° Lon | |
| 5 | SC:L70RWRS.002:2000097459 | 06 Jul 1999 | 1:22:21 | 53.10° Lat, 141.69° Lon |
| 6 | SC:L70RWRS.002:2000156177 | 19 Aug 1999 | 1:46:44 | 54.51° Lat, 136.21° Lon |
| 7 | SC:L70RWRS.002:2000167896 | 26 Aug 1999 | 1:52:37 | 55.91° Lat, 135.38° Lon |
| 8 | SC:L170RWS.002:2000144217 | 12 Aug 1999 | 1:40:13 | 55.91° Lat, 138.48° Lon |
| 9 | SC:L170RWS.002:2000144220 | 12 Aug 1999 | 1:40:37 | 54.50° Lat, 137.74° Lon |
| 10 | SC:L170RWS.002:2000144223 | 12 Aug 1999 | 1:41:01 | 53.10° Lat, 137.05° Lon |
| 11 | SC:L170RWS.002:2000102628 | 02 Jul 1999 | 1:45:02 | 60.09° Lat, 139.45° Lon |
| 12 | SC:L170RWS.002:2000102638 | 02 Jul 1999 | 1:45:26 | 58.70° Lat, 138.56° Lon |
| 13 | SC:L170RWS.002:2000200011 | 04 Jul 1999 | 1:33:06 | 58.70° Lat, 141.65° Lon |
| 14 | SC:L170RWS.002:2000106616 | 14 Jul 1999 | 2:08:38 | 64.22° Lat, 136.40° Lon |
| 15 | SC:L170RWS.002:2000106619 | 14 Jul 1999 | 2:09:02 | 62.85° Lat, 135.27° Lon |
| 16 | SC:L170RWS.002:2000106622 | 14 Jul 1999 | 2:09:26 | 61.47° Lat, 134.22° Lon |
The accuracy of fire scars mapping was computed from Landsat -7 (ETM+) satellite data. We choused approximately 10 summer 1999 scenes with less than 10% cloudiness from the EOSDIS catalogs. In the Landsat images we selected fire scars boundaries and compared them with NOAA/AVHRR data.
TASK 5: PRE-FEASIBILITY STUDY FOR REGIONAL FOREST MAPPING USING RESOURS/MSU-SK DATA
We started to design a GIS as a tool to provide the concurrent processing of satellite data and cartographic and dendrologic database. The GIS should provide an instrument for storage and efficient data access.During the period covered by the interim report, the following data were included into the experimental GIS of the test region:
- Digital topographical base DCW (scale 1:1 million);
- The database of Usolsk leskhos forest fund, which was created using the 1992-1993 forest inventory data;
- Digital coverage of forest stands damaged by Siberian silkworm, according to the 1995 - 1996 inspection data;
- Parts of MSU-SK/RESURS-O1 images, surveyed in August 1998.
Digital topographic base
For a cartographic base of the GIS we chose the digital topographical map DCW, generated by ESRI specialists under a contract from the department of military cartography of the US Ministry of Defense. From the complete set of map coverages, the following coverages were included into the GIS: ocean and sea shorelines, rivers, roads, settlements, and some relief elements.
The selected coverages of DCW map were prepared to be included into the experimental GIS by their extraction from the global coverage using the geographical coordinates of test region followed by reformatting into the storage vector formats of ARCVIEW, ARC/INFO, and ERDAS Imagine.
Forest fund database
A forest fund database was designed from the products of cartography and from forest taxation data that were measured during forest management.
Pre-processing of the forest fund data was performed by digitizing of the boundaries of forest enterprises and forest quartiles, and of the elements of road and river network, as shown in the forest maps of Usolsk leskhos, and storing in digital vector format.
The database of forest taxation data is presented in a form of a set of relational tables, which describe different factors of forest stand condition, and which are grouped according to forest districts. The table fields contain numerical data and symbolic information. The data symbols satisfy the SOLY (the system of information about forest taxation) standard, which is accepted in Russia and is supported by the manuals. The manuals are electronically published in dBase III format. They enclose the keywords and correspondent text descriptions.
Digital cover of forest damage
Digital maps of forest stand damage were generated from the correspondent schematic maps, which were drawn using the processed data of aerial photography. The boundaries of damaged territories were drawn at the forest inventory map case, using several damage levels.
Attribute characteristics in the coverage data model with polygonal structure permits separation of the polygons with different damage levels. Attribute tables contain the codes of damage level, as occurred in 1995 and 1996. The codes represent the following levels of damage: undamaged stands, stands with less than 25% of damage, stands with 26-50%, 51-75%, and more than 76% of dead fir, spruce and cedar trees.
Satellite images
We studied the resources of regional forest mapping using the images of medium resolution scanner MSU-SK of RESURS-O1 satellite. At the present time, two satellites of the RESURS-O1 model of satellites at near-Earth orbits are operative: RESURS-O1 #3 (launched October 4th, 1994) and RESURS-O1 #4 (launched July 10th, 1994).
Russian spacecraft of this model has onboard the high (MSU-E) and medium (MSU-SK) resolution equipment, which provides terrain scanning in several parts of spectrum. Table 6.1 describes briefly the set of scanning equipment onboard RESURS-O1 #3 satellite. It includes the following:
- A unit with two multi-spectral optical electronic scanning devices of high resolution MSU-E, which share a single turning base. Each of the MSU-E cameras includes three hardbody 1000-element optical sensors, which work in different parts of spectrum.
- Two sets of multi-spectral conic optical mechanical scanning devices of medium resolution MSU-SK.
|
Parameter |
MSU-E |
MSU-SK |
|
Spectral channels |
0.5-0.6, 0.6-0.7,0.8-0.9 m m |
0.5-0.6, 0.6-0.7, 0.7-0.8, 0.8-1.1, 10.4-12.6 m m |
|
Spatial resolution |
45 m (across the orbit) |
150 m (optical and near infrared) |
|
Radiometer precision |
256 levels |
256 levels |
|
Width of survey area |
45 km |
600 km. |
Basing on climate conditions, forest phenology, and optical condition of the atmosphere, the time period from June 15-20 till August 20-30 was found to be the best period for remote sensing from space for the test region. This time period was used as a basis for selection the images of the test region. The image selection was done in the Internet catalogs of ScanEx Research and Development center. This center had made the construction of the information receiving stations for Resurs-O1 model of the satellites.
A selection process took into consideration a chosen time period and image cloudiness. Two scenes from Resurs-O1 #3 were selected for study of spectral signatures of different categories of forested and not forested lands.
Geometric correction of MSU-SK images was processed from the elements of the orbit. Additionally, we used the ground control points (GCPs) from the digital map DCW. For this purpose we used geometric correction software, developed by DATA+ specialists for ERDAS Imagine. This software helps to refine the Resurs-O1 orbital parameters, taking into consideration the GCPs, found on a topographical map. For these points, we used the confluence points of big rivers, shorelines of water bodies, and road junctions. Average precision of geometric refinement of satellite images for scenes #1 and #2 was 300 meters and 285 meters, correspondingly. Precision of co-registration of two satellite scenes was 80 meters.
Description of the test region images, received from the MSU_SK scanner of RESURS-O1 satellite.
|
Parameter |
Scene #1 |
Scene #2 |
|
Image date |
August 10th, 1998 |
|
|
Image time, GMT |
03:14:18 |
03:13:27 |
|
Sun height above horizon, degrees |
56° |
58° |
|
Sun azimuth, degrees |
85° |
100° |
|
Amount of rows in the image |
7900 |
2672 |
|
Amount of elements in a row |
2550 |
2520 |
For joint usage with the GIS data of the test region, the images were transformed into conic projection.