| MAIN |
| ABOUT A PROJECT |
| OBJECTIVES |
| TEST REGIONS |
| DATA BASES |
| STUDY RESULTS |
| REPORTS |
| CONTACTS |
Description of remote sensing data

Methods of forest change detection that use RESURS/MSU-SK data
Brief description of methods used for change detection
Discussion of first results and recommendations on application of medium resolution satellite data for detection of regional forest change
Pic 1
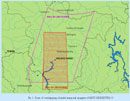
Zone of overlapping of multi-temporal imagery of MSU-SK/RESURS-O
Pic 2
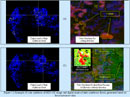
Example of color synthesis of MSU-SK image and digital mask of dark coniferous forest, generated based on forest inventory data
Pic 3
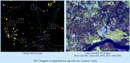
Fragment of change detection map with some "anomaly" classes
Methods of forest change detection that use RESURS/MSU-SK data
Brief description of methods used for change detection
Discussion of first results and recommendations on application of medium resolution satellite data for detection of regional forest change
Pic 1
Zone of overlapping of multi-temporal imagery of MSU-SK/RESURS-O
Pic 2
Example of color synthesis of MSU-SK image and digital mask of dark coniferous forest, generated based on forest inventory data
Pic 3
Fragment of change detection map with some "anomaly" classes
In Russia forest inventory is based on data collected from single forestry units (lesckozes). The inventory includes development of forest maps and forest inventory databases. Average inventory return period is ten years. This causes substantial delays in correction of forest fund data.
Attempts to develop technology for more frequent renewal of forest inventory data, which would use the data from Russian satellites, have a long history. However, until now not a single methodology has been adopted in forestry for practical use. This fact can be partially explained by availability of data from Russian natural resources satellite systems, including the images from MSU-SK/RESURS-O medium resolution scanner. Now this situation is changing for better. Some organizations that own satellite receiving stations have got a possibility to receive MSU-SK data and to support the up-to-date data archives. Nevertheless, a study of different methods of change detection with MSU-SK data would need archived data for at least a decade. As of the date, there are no such digital archives with all-Russia coverage.
Forest clear-cuts, wildfires, and insect outbreaks are the most frequent disturbance types in the forests of test regions. Yet, we do not have any early-90s data for the test region. This is why we could not investigate the application of MSU-SK/RESURS-O data to change detection using the whole set of known methods.
Description of remote sensing data
We analyzed the archived MSU-SK scanner data from RESURS-O satellite collected by various Russian and international bodies in order to find out what information is available for the test territory. The data from medium resolution scanner MSU-SK has been continuously collected for the Angara region starting from 1997. No digital image covering this territory exists for pre-1997 period in any organization. The absolute majority of archived images cover the European part of Russia and Western Siberia (Urals). We have searched for data in archives that belong to NITS PLANETA (Scientific Centre PLANET), SCANEX, West Siberian RTSPOD. The shortage of data archives considerably complicated our reserch of forest change connected with insect outbreaks, including the outbreaks of the Siberian silkworm. In 1994-1997 there was an outbreak of the silkworm in forests of the Angara region.
During our research of the possibilities to detect current forest change connected with clear cuts and wildfires, we reversed the direction of our search for historical data. We tried to find recent satellite images and to detect recent changes covering the 1998 - 2000 period. But even here we succeeded only partially. The current condition of RESURS-O satellite is such that only a single satellite of a third generation is working on the orbit. The work capacity of this satellite is substantially decreased. Because of that, power-demanding working regimes of sensing equipment are very limited. At this time, regime #3 is the principal regime used for earth scanning. In this regime, all the channels of a high resolution scanner MSU-E (45 m) and two channels (red and near infrared) of a medium resolution scanner MSU-SK (500 m) are working. Also note that the MSU-SK scanner works in surveying regime: only the even rows of images are transmitted to a ground station.
Due to these complications, we managed to order and receive summer 2000 images of the test region taken in two bands of electromagnetic spectrum. Table 1 lists brief characteristics of these images.
Concluding, for our research of change detection we used summer 1998 and 200 remote sensing data describing the test territory. Pic 1 shows overlapping zones of the images.
Table 1
Description of the test region images, received from the MSU_SK scanner of RESURS-O1 satellite
| Parameter | Scene |
| Image date | June 23rd, 2000 |
| Image time, GMT | 04:44 |
| Sun elevation, degrees | 48° |
| Amount of rows in the image | 3660 |
| Amount of elements in a row | 5403 |
Methods of forest change detection that use RESURS/MSU-SK data
Methods of change detection
During the last decade, many new methods of forest change detection, which use digital remote sensing data, have been developed. These methods are widely publicized in recent contemporary scientific periodical [12,13,14]. One can divide these methods into four groups based on their complexity (table 2). Each of the methods has advantages and disadvantages of its own.
- Mono-temporal change delineation.
All the methods of this group analyze a single scene, which shows an object of monitoring after the change. It means that the methods do not use any past images, which is considered to be the methods' advantage. To find initial (before change) spectral brightness of the object, the methods use either digital forest maps or a spectral signatures database of unchanged objects of the same type. The analysis should also include a human expert who knows the object of research or an expert system adjusted to characteristics of researched territory and types of change typical for this territory.
Table 2 Classification of digital change detection techniques
Complexity groupings Techniques Linear procedures Difference images Classification routines Rationed images
Post-classification change detection
Spectral change pattern analysis
Logical pattern change detection
Layered spectral/temporal change detection vector shiftTransformed data sets Albedo difference images component analysis
Vegetation IndicesOthers Regression analysis
Knowledge-based expert system
Mono-temporal change delineation - Post-classification comparison
These methods can be applied to find anomalies in results of unsupervised classification of images sensed at various times. Main area of application of such methods is monitoring of transformations of a territory. These methods do not need a mutual radiometer calibration of two analyzed images, and this is an advantage. One the other hand, accuracy of the method and accuracy of found transformations depend on results of initial classification. - Multi-dimensional temporal feature space analysis
In this approach, channels of multi-temporal satellite images are employed to generate intermediate products. These products are further analyzed using a computer monitor. This method seems to be the most appropriate for natural objects with weak transformations. However, the method depends on preliminary generated masking images to reduce interference from unchanged parts of an analyzed image. - Composite analysis
This approach uses classification methods to find and identify anomalies. The methods work with images taken by a single satellite at similar sensor positions and at the same phenological period, but at different times. This method uses only one step of classification, yet, it is considered as being quite complicated. The reason for that is that it needs a complete set of multi-temporal satellite data and a-priori knowledge about links between classes. - Image differencing
Image differencing is probably the most popular algorithm of detection of different types of change. The methods employ either differential vegetation indices, calculated by combining of same-type channels, or a difference of initial channels of radiometric images after they are radiometrically normalized. Pixels outside the {[M-2*s];[M+2*s]} interval are considered as anomalies. - Multi-temporal linear data transformation
Linear transformation methods (spectral channel transformation methods) are frequently used for change detection. A representative example of such methods is principal component analysis - PCA.
The main part of principal component analysis is rotation (saving Euclidean distance between the points) of a coordinate system of initial n-dimensional space of channels - such a way, that the new coordinates are not correlated. Coordinate system rotation generates axis with very distinct dispersions. The first axis has maximum dispersion. This method allows to move anomalies of different types to different components. This approach is quite productive, yet it needs expert knowledge about the territory under research. It also needs data preprocessing to detect weak anomalies. Very noisy images can also be hard to process by this method.
The nature of collected MSU-SK/RESURS satellite data prompted us to use the following methods of change detection in our project:- Change detection using mono-temporal change delineation;
- Change detection using an analysis of image differencing.
Brief description of methods used for change detection
Mono-temporal change delineation
We applied this method for cooperative processing of cartographical and forest inventory database, which was a part of the test territory GIS, and multi-band remote sensing data from medium-resolution scanner MSU-SK aboard RESURS-O satellite. During 1992-1993, there was a regular forest inventory on the test territory. Since in our research we tried to detect forest change due to the 1994-1997 Siberian silkworm outbreak, availability of this forest inventory data came handy.
Analysis details can be found in [9]. The main idea of the method is that statistical homogeneity of satellite image brightness is directly connected to a homogeneous natural object, limited by a digital mask, generated from forest inventory databases. Strong brightness anomalies of satellite image should correspond to such territory transformations that cannot be found on the map.
It is possible to display on a computer monitor the researched territory alone and to exclude all other details of satellite image. This can be done by color composition of two zonal satellite images and digital mask with further modifications of mask brightness function. Mask brightness function sets brightness to zero for those objects that currently are under analysis. It also sets brightness to maximum for the whole range of other possible values and can be modified interactively for subsequent analysis of different objects.
This approach has been tested in a research [9] of transformations due to clear cuts. These transformations lead to increasing brightness in red and near infrared parts of spectrum. We analyzed the possibility to apply this method for wide-scale forest damage due to a silkworm outbreak. Contrary to the previous task, here we have decreasing brightness for both channels.
Image differencing
We used the method [14] to detect changes by computing pixel-by-pixel image difference with further interpretation of radiometric changes. In this research we applied two approaches:
- Computation of differential images from channel data of two images of the same area from different dates. The channel radiometry is normalized using coefficients of regression.
- Computation of differential images from channel data. The channels are normalized using their sum total (in other words, we use multitemporal different normalized vegetation index).
The first approach uses a method of two-step brightness normalization for images from different dates, which includes regression analysis. During the first step, regression between the cloudless channels is computed. Then it is possible to find coefficients of linear transformation of one of the channels into the other:
CHibefore = ai*CHiafter + b>i, where
a and b - coefficients of regression equation;
i - channel number.
Coefficients of regression equation are controlled by brightness of pixels that correspond to forest change. To diminish anomaly pixel influence on dispersion of brightness distribution of investigated channels, we computed a territory mask for those pixels with brightness in the following limits: {[M-s];[M+s]}. Here, M - mode of differential image histogram, s - standard deviation. It was assumed that all the changes could be found at the edges of differential image histogram.
During the second step of radiometric normalization, we computed correlation between the channels of images from different dates (excluding clouds) and then detected territory transformation. After that, we adjusted brightness of one of the channels into brightness values of the other using corrected regression coefficients a and b. Finally, we generated differential images for all channels and classified anomaly pixels, i.e. the pixels with values outside the {[M-2*s];[M+2*s]} interval of brightness distribution of differential images.
During the last step of the method of change detection, the classes of found anomalies are classified using all kinds of information describing researched territory, e.g. forest maps, forest inventory databases, manually processed satellite images, etc.
The second approach first generates differential images from primary channels using the following formula:
difNDVIj=(CHjafter - CHjbefore)/( CHjafter + CHjbefore) , where
CHjbefore - image brightness for channel j, before the researched territory was changed,
CHjafter - image brightness for channel i, for current condition of researched territory.
Using normalized differential indexes from various dates, it is possible to mitigate partially negative atmosphere interference. The approach further employs the same classification of anomaly pixels we have already discussed above as the first approach of change detection.
Discussion of first results and recommendations on application of medium resolution satellite data for detection of regional forest change
In our research we tested all methods of change detection which were discussed in the previous chapter of the report. In this part of our report we list the conclusions about applicability of MSU-SK images for tasks of forest change detection which we made from the results of our research.
Pic 2 shows some typical images of brightness anomalies generated from data of dark coniferous forest stands. These anomalies can be classified as a recent forest clear cut (a) and dead forest, damaged by the Siberian silkworm.
We used such forest inventory parameters as main forest species and age class to build digital mask. The research area was localized by modification of brightness function of digital mask. We performed localization for forest stands with the following main species: fir, spruce, and cedar in mature and pre-mature age classes. Brightness anomalies found were primarily interpreted using a GIS, research data of forests damaged by insects, and forest inventory data. After the anomalies were analyzed, we found that large clear cuttings can be reliably recognized by their rectangular shape and by adjoining forest roads.
To recognize dead forest stands damaged by silkworm outbreaks, one needs aerial photographs or results of its interpretation for manual teaching. Land categories, main species, and age classes belong to those parameters of forest inventory suitable for generating masks. According to official forest inventory procedure, in old clear cutting areas coniferous species are always determined as main reforestation species. In fact, the majority of clear cuts are covered with closed young deciduous stands with spectral properties similar to those of trees and shrubs. Algorithm of mask generation should take this peculiarity into consideration.
Table 3 lists the results of change detection with a differential method with two-step radiometric normalization of channels of images from different dates.
It can be easily seen from the table that this method allows to find different vegetation characteristics, correspondent to deforestation and reforestation (clear cutting areas, forest thinning, reforestation on clear cuts and old burned areas), from medium-resolution MSU-SK images scanned at different dates.
Table 3 Analysis of brightness change in two channels (2 and 4) of RESOURCE-O1 satellite image, with correspondent anomaly classification.
| Class number | Brightness change in channels | Anomaly classification | |
| Red | Near infrared | ||
| 1 | Fresh clear cut, currently in process of reforestation | ||
| 2 | Large-scale vegetation destruction (up to bare ground) in forest openings. | ||
| 3 | 0 | Possible thinning, change of forest density, usually in coniferous stands. | |
| 4 | Dead deciduous forest (possible wildfire) | ||
| 5 | Reforestation with trees and shrubs on recent (1-2 years) clear cuts. | ||
| 6 | 0 | Reforestation with trees and shrubs on clear cuts (older than 2 years). | |
| 7 | 0 | Reforestation with trees and shrubs on clear cuts (older than 2 years). | |
| 8 | 0 | Dead coniferous forest (possible wildfire) | |
Here,
0 - unchanged brightness in a channel.
Similarly, this method can be applied to detect forest change due to fires and insect outbreaks on MSK-SK images. However, for better reliability more research is necessary. It is necessary to improve identification of such changes using current forest inventory data describing the tested territory.
The third method of change detection is based on computed differential vegetation index for different dates. The methods allow change detection in forests with areas of clear cuts and selective forest thinning. However, the method classifies both of these categories as one class of change. Brightness deviation in images of different dates results in increasing normalized vegetation index difNDVI in red and near infrared channels.
We could not make an exact interpretation of index decreasing using information about contemporary state of forest change in test region. We believe that these anomalies were forced by forest destruction due to fires and insect outbreaks. In near infrared band vegetation index becomes negative and in red band it does not deviate. Pic 3 shows some examples of change categories detected in medium resolution images of MSU-SK.
Our analysis allowed the following preliminary conclusions about applicability of medium-resolution MSU-SK images to change detection:
- Red (600-700 nm) and near infrared (900-1100 nm) channels of scanner are the most informative. This conclusion is also supported by detection of weak changes (e.g., thinning) in the images from surveying mode of satellite operation (channels 2 and 4 with 500 m resolution).
- If forest inventory data are available, one can apply change detection method that uses a single image. However, only large-scale forest changes can be detected.
- Burned areas and forests damaged by fires are the most difficult to be detected. This change category is influenced by fire intensity and different types of forest (mature coniferous forest, clear cuts, etc.) Hence, anomalies of brightness change can vary significantly. Detection of change in recently burned areas is possible only after an additional research of detailed descriptions of different burned area types. However, our preliminary results of processing of existing image sets show decreasing brightness in both channels of MSU-SK images for this type of change brightness.