| MAIN |
| ABOUT A PROJECT |
| OBJECTIVES |
| TEST REGIONS |
| DATA BASES |
| STUDY RESULTS |
| REPORTS |
| CONTACTS |
The algorithm of detection of active fire
The algorithm of fire hot spots detection is based on the modified context algorithm, which was designed at Joint Research Center for Global Fire Product development.
During the initial step, a remote sensing image is analyzed in order to classify it into one of the three categories: night time, morning and evening time, or day time. The purpose of this classification is to adapt the algorithm for temperature attributes of fires that are typical for different time of day, and to filer out the "false alarms" due to sunlight reflections. Image classification into one of the three categories is based on the analysis of supplementary image, composed from the values of sun zenith angles. A context-adapted algorithm is applied to each of these categories of images.
An additional step has been included into the analysis procedure in order to analyze the results of fire detection in a pre-set location and to enhance the probability of correct recognition.
Processing of night images.
A specific of fire detection in the images of this category is the lack of "false alarms" due to sun reflections from water bodies (sunglints), from top of the atmosphere, and from the hot areas of land cover (desert area). It should be noticed that lower intensity of fires during the night time and lower energy radiated from the land cover results in comparatively small difference in brightness temperature of "fire" and background pixels of the 3rd, 4th, and 5th channels.
A pixel is marked as a "potential fire" under the following conditions: T3 > 295K, T3-T4 > 4K, and T4 > 265K. Then, a "potential fire" is assumed to be a real fire under the following conditions:
- [T3 - T4] > T34f+1.5s34f
- T3 > T3f+2s3f+3K
- T4 > T4f+0.5K
Processing of morning and evening images.
Solar reflections influence these types of imagery, though the fire intensity is just slightly increased when compared to night fire regime. Consequently, a pixel is marked as a "potential fire" if it satisfies the following conditions:
T3 > 298K, T3-T4 > 6K, T4 > 265K, R2 < 35%.
Then, a "potential fire" is assumed to be a real fire under the same conditions, as were listed for the nighttime images.
Processing of daytime images.
Various boundary rules of filtering are necessary because of high probability of a "false alarm".
A pixel is marked as a "potential fire" if T3 > 308K, T3 - T4 > 8K, T3 - T4 - 3×(T4 - T5) > 4K (this masks open hot spots) and R1 - R2 >1% (this masks reflections from water bodies).
Then, a "potential fire" is assumed to be a real fire under the following conditions:
- [T3 - T4] > T34f+2s34f
- T3 > T3f+2.5s3f+3K
- T4 > T4f+1K
- R2 < 25% - masks reflection from clouds.
- T3 > 321K,
- T3 > T3f+2s3f+3K,
- T3 - T4 > 5K,
- T4 > T4f+1.5K,
- R2 < 15%.
R1 and R2 - 1st and 2nd channels albedo,
T3, T4, and T5 - brightness temperature of the 3rd, 4th, and 5th channels,
T4f - an average background brightness temperature of the 4th channel,
T3f - an average background brightness temperature of the 3rd channel,
T34f - an average difference [T3-T4] of background pixels,
s3f - standard deviation of background brightness temperature of the 3rd channel,
s34f - standard deviation of difference [T3-T4] of background pixels.
This chapter contains a description of a general algorithm for fire detection, using the images surveyed at different day hours. Only the light time images of NOAA 14 satellite, which were collected during the 1998 fire season, have been used for the experiment.
EXPERIMENT RESULTS
Experiment methodology
The experiment of registration of NOAA-AVHRR image pixels with the real fires included the following steps:
- Manual selection of cloud free images;
- Georeferencing of the selected images using the satellite orbital parameters;
- Refinement of image georegistration using the global water mask image;
- Detection of hot spots where fire has probably acted;
- Transformation hot spots into map coverage and including into GIS.
The initial two steps were processed by a program shell, designed for pre-processing of the remote sensing information from NOAA satellites. The shell allows to load and to look at the AVHRR remote sensing images, to geocode the images with orbital parameters, to correct radiometric information, and to export the images into the data storage formats of the successive processing steps.
During the next step, spatial registration of the images, which were georeferenced using the satellite orbital parameters, was refined. The georegistration algorithm analyzes water mask image DCW and water bodies, derived from NOAA-AVHRR. Adaptive thresholds allow enough precision of masking for such areas. The maximum of correlation between the two bite masks was used as a decisive factor for calculation of linear shift. The calculated shifts were used to correct geographical coordinates of each image.
Then, the hot spots were detected in AVHRR images and their geographical coordinates were defined. The results of processing were output into text files that contained the coordinates of hot spots detected.
The final step of experiment processing was generation of map covers, which contained the necessary attributive information about each of the active fire areas. For each of detected active fire areas the following parameters were produced: date and time of detection, the number of satellite orbital overpasses, perimeter and area (in km2) of active fire. GIS ARCVIEW 3.0 map coverage was selected as a base format for storage and further processing of results of computing.
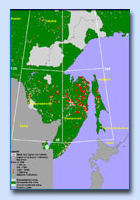
Pic.1
Location map of forest fire mapping study region within Far East
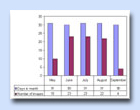
Pic.2
Quantity of NOAA-AVHRR images per months allowed after pre-processing for hot spot detection analysis
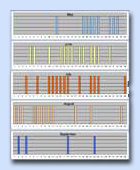
Pic.3
Distribution of NOAA-AVHRR imagery per days during fire season
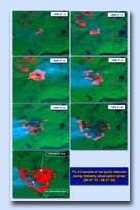
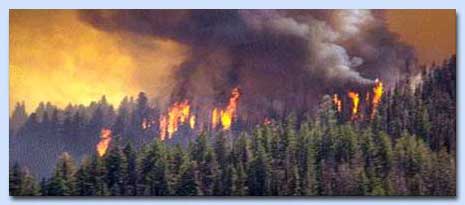
Pic.4
Example of hot spot detection during following observation period ( 98.07.12 - 98.07.30 )
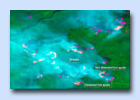
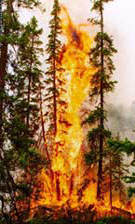
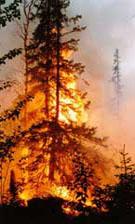
Pic.5
Example of hot spots detection blanked with smoke
The test region was separated into four equal parts for their easier processing and to reduce the size of processed images (Pic 1). During the interim report period the processing was completed for the images that covered one quarter of the test region. The computed results of fire detection allowed us to make a preliminary analysis and to draw some conclusions.
82 images were selected for pre-processing from the initial set of NOAA-AVHRR satellite data (171 images) after manual control of cloudiness. The selected images had less than 20% of clouds. Pic 2 charts a monthly distribution of the selected images for the vegetation period. The largest quantity of the images that are free from clouds and available for further processing is received in May and during the summer month of the year. Pic 3 charts a daily distribution of the images for each month.
The processing of 82 images resulted in detection of 4278 forest fire locations. This includes 424 locations in Sakhalin region, 3735 in a part of Khabarovsk region, and 19 in a part of Primorsky kray. The total area of active fire was 1671 thousand ha.
During the manual analysis of detection results, some specific features of the designed approach were found and the experiment methods were corrected. Firstly, the disqualified images created temporal brakes in active fire observations. This limited the resources to perform the continuous monitoring of fire progress and to compute the actual burned area. This problem is important for large forest fires, which were covered by clouds for a significant amount of time. Using the images, one can manually detect burned locations with much larger area than the total area of the hot spots (Pic 4).
Secondly, a territory with a large amount of active fires burning at the same time can be considerably blacken with smoke. This results in changed values of albedo and of brightness temperature of hot spots that are manually recognizable in the images as an open fire (Pic 5). However, these pixels are not detected as hot spots, because their values do not satisfy the threshold conditions of the algorithm.
As a conclusion, the following results were received during the interim project period:
- A software for NOAA-AVHRR processing, which allows to detect the pixels with active fires, was developed;
- There was created a database of forest fires, which contains the forest fire data collected for the test region by airborne and ground services of forest protection during the year 1998. The database will be used for future verification of processing results.
- The archived 1998 NOAA-AVHRR data were processed for a part of the test region. Some preliminary conclusions were deduced from the initial results.
- Image disqualification creates temporal brakes in active fire observations. This limits the resources to perform the continuous monitoring of fire progress and to compute an actually burned area.
- To make correct assessments of areas of active forest fires, it is essential to consider not only the detected hot spots, but also the burned territories inside the areas. The latters can be extracted by analyzing the albedo values of the first and second channels of the image in a close neighborhood of the hot spot.
- The existing algorithm of image processing should be modified to permit detection of hot spots, which are covered with smoke. This will allow fire detection in the territories blackened with fire smoke.