| MAIN |
| ABOUT A PROJECT |
| OBJECTIVES |
| TEST REGIONS |
| DATA BASES |
| STUDY RESULTS |
| REPORTS |
| CONTACTS |
Development of legends for thematic products, generated from RESURS/MSU-SK data

Thematic processing methods for RESURS-O/MSU-SK images
Discussion of results and recommendations about applicability of RESURS-O/MSU-SK data for regional level forest mapping
Recommendations to application of RESOURS/MSU-SK data for regional scale forest mapping
Thematic processing methods for RESURS-O/MSU-SK images
Discussion of results and recommendations about applicability of RESURS-O/MSU-SK data for regional level forest mapping
Recommendations to application of RESOURS/MSU-SK data for regional scale forest mapping
Pic 1
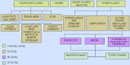
The structure of forest classification of test region by RESURS-O/MSU-SK imagery
The structure of forest classification of test region by RESURS-O/MSU-SK imagery
Pic 2
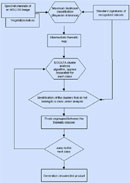
Flow diagram of thematic processing of RESURS-O/MSU-SK satellite images
Flow diagram of thematic processing of RESURS-O/MSU-SK satellite images
Pic 3
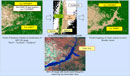
Example of "forest - non-forest" map before and after renewing of thematic classes based on analysis of classes distribution in bi-directional histogram of channels of MSU-SK image
Example of "forest - non-forest" map before and after renewing of thematic classes based on analysis of classes distribution in bi-directional histogram of channels of MSU-SK image
Pic 4a
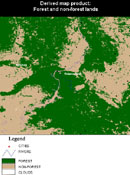
Derived map product:
Forest and non-forest lands
Derived map product:
Forest and non-forest lands
Pic 4b
Derived map product:
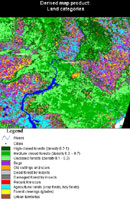
Land categories
Derived map product:
Land categories
Pic 4c
Derived map product:
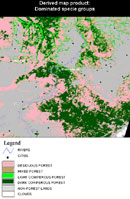
Dominated specie groups
Derived map product:
Dominated specie groups
Pic 4d
Derived map product:
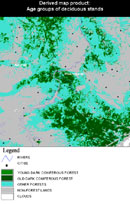
Age groups of deciduous stands
Derived map product:
Age groups of deciduous stands
Development of legends for thematic products, generated from RESURS/MSU-SK data
Analysis of spectral separation of main forest and non-forest lands and of their area in the test region proposed the following structure of MSU-SK image classification (Pic. 1):
Lands that are not covered with forests and non-forest lands are aggregated into one "non-forest" class. The first detailing level includes the following classes: "forest" (lands covered with forests), "non-forest" (lands not covered with forests), clouds, snow, water, and cloud shades. The second detailing level breaks forest and non-forest classes into several categories. Non-forest class breaks into agricultural lands, water, urbanized (special-purpose) lands, bogs. All these non-forest categories are statistically significant in our test area. Non-forest class also includes some categories from the lands that are not covered with forest: clear cuts, fire scars, dead plantations, forest clearings. The other land categories present in the test area, i.e. forest nurseries (0%), plantations (0%), unclosed young forests (0.4%), glades (0.001%), human and natural sparse woods (0%), were not significantly enough to be included into the legend.
The natural forests and plantation are aggregated into one "forest" class. The first detailing level includes the following three classes with different density: low-density forests (density 0.1 - 0.3), medium-density forests (density 0.3 - 0.7), high-density (dense) forests (density 0.7-1). An additional class includes forests damaged by insects with defoliation less than 50%. The lands covered with forests have also the third and the fourth detail levels. Those levels specify age structure and species composition of closed forest stands.
Spectral analysis of signatures of main tree species which we run for the forests of the test region, allowed us to separate three main forest vegetation types: coniferous (light coniferous and dark coniferous), mixed, and small-leaf deciduous (birch and aspen) forests. During MSU-SK image classification (for details see the next part of the chapter), the coniferous were separated into light conifers and dark conifers. Mixed forests have equal participation of coniferous and deciduous species in tree stands. We unified birch and aspen forests into one class because their spectrums are hard to separate on a single MSU-SK image.
We devised the fourth-level legend after we had analyzed separation of spectral signatures of different age classes of different species. For the most species, it was relatively easy to separate young forest stands of 1st and 2nd age classes from mature and premature stands. The middle age stands were equally easy to be confused with young and mature stands. This is a transitional class that is hard to classify from aerial photographs. Considering the above mentioned, we suggested that the most appropriate would be to separate all age classes into two main groups: young stands (1st and 2nd age classes) and mature stands (middle age, premature and mature).
These considerations suggest that the following theme products with legends can be produced from single mid-resolution images MSU-SK/RESURS-O:
- FOREST - NON-FOREST MAP:
- forest (high-density, medium-density, low-density, and damaged stands)
- non-forest (bogs, water, burned areas, dead stands, urban territories, agricultural lands, clear cuts, forest clearings).
- MAP OF LAND CATEGORIES:
- high-closed forests (density 0.7-1);
- medium-closed forests (density 0.3 - 0.7);
- unclosed forests (density 0.1 - 0.3);
- bog;
- water;
- recent fire scars and dead forest, damaged by insects;
- damaged forests;
- urban territories;
- agricultural lands (crop fields, hey fields, grazing lands);
- forest clearings
- MAP OF MAIN SPECIES:
- deciduous forests;
- mixed forests;
- light conifers;
- dark conifers.
- MAP OF AGE CLASSES FOR DECIDUOUS FORESTS
- Young forest stands (young stands of first and second age class);
- Mature forest stands (medium age, premature, mature, and overmature);
- MAP OF AGE CLASSES FOR DARK CONIFEROUS FORESTS
- MAP OF AGE CLASSES FOR LIGHT CONIFEROUS FORESTS
- MAP OF AGE CLASSES FOR MIXED FORESTS
Thematic processing methods for RESURS-O/MSU-SK images
Our research was based on the forest inventory database of the test region and on middle-resolution images, produced from multi-spectral MSU-SK sensor of RESURS-O satellite. We adjusted methods of thematic processing to the interim results of satellite image classification, which we collected during our research. Our methodology was based on hierarchical image classification approach. As we went from one detailing level to the next level, the number of classes increased.
We used both the supervised and unsupervised classification methods. We applied the first one to preliminary image classification, using a priory information about the classes under investigation. The second method was used to correct the class spectral signatures found. A simplified scheme of MSU-SK image processing with further generation of a thematic product can be found in Pic. 2.
For a method of supervised classification, we used a Bayesian process of logical inference - determining what degree of confidence we may have, in various possible conclusions, based on the body of evidence available. The process consists of probabilistic analysis of classes and search of strategy to minimize expected losses or relative risk. We analyzed distribution density p(x|wj) of standard samples that belong to recognized classes to find their a posteriori probability P(wj|x). Then we searched for a decision rule wj , which would return the minimal average probability of incorrect recognition of a class C. In other words, we used the following rule of error minimization:
decision wj is accepted, if P(wj|x) > P(wj|x) far all j i,
where i, j = 1,…c - classes.
Probability of correct class recognition with supervised classification depends on correctness of standard spectral signatures of classified objects. The algorithm uses distribution density of the signatures to optimize decision rule.
Methods of unsupervised classification, applied separately for each recognized theme class, can reduce those classification errors that are connected with imprecise distributions of class standards. These deviations are associated with referencing errors of satellite images and forest maps and errors in forest inventory data. For this purpose, we used cluster analysis to separate analyzed parameter space into spectrally uniform clusters. Input of this algorithm is multi-dimensional parameter space (i.e., spectral channels and their ratios), limited with distribution density of analyzed class.
Cooperative manual analysis of distributions of cluster brightness and standard signatures in two-dimensional space of spectral parameters shows anomaly bright clusters at class histogram edges. When irregular pixels of those clusters are mapped into initial image to be manually analyzed and compared with forest maps, we can identify the class of theme map they should really belong to. Then we can regroup the pixels (Pic. 3).
Let A1, A2..,Af be subsets (clusters) of a set F (e.g., class "forest"). Let B1, B2..,BS be subsets (clusters) of a set S (e.g., class "non-forest"): {Af|fe F} and {Bs|se S} . Let us also suppose that after the clusters had been manually interpreted, it was found that, in fact, subset A1 does not belong to F, but belongs to S. Then, the sets would be re-defined: S'=CFCFA1 and S.
Discussion of results and recommendations about applicability of RESURS-O/MSU-SK data for regional level forest mapping
We used ERDAS Imagine 8.4 shell and the methods described in previous section to experiment with process MSU-SK images. The practical steps of processing varied, depending on intermediate cartographic products and legend specifics. There were the following processing steps.
As the first step, we classified the images into two classes "forest" and "non-forest" with maximum likelihood method. For classification we used the prime spectral channels and, additionally, vegetation index, which is a ratio of the red and near-infrared channels. Pixels of prime channels were corrected with constant parameters to shift significant parts of histograms to origin of coordinates:
RVI=(R-DNr)/(IR-DNir), where
DNr = 23 - correction constant for the red channel R (2nd channel of MSU-SK), DNir = 20 - correction constant for the near infrared channel IR (4th channel of MSU-SK). DN -digital number of image {0..255}
This index takes into consideration how projection area of one "forest" pixel of a satellite image deviates in relation to that of a "bare ground" pixel. After the map had been corrected using cluster analyses, that map was validated and its accuracy was analyzed.
During the next step, the parts of image classified as "forest" and "non-forest" classes were processed separately using the same methods. A purpose of this thematic processing was to produce a map of land categories of second level of details (see Pic. 1). Then, the procedure was repeated for closed stands classes to discriminate those into groups of different main species.
During the last step, image parts with different main species groups were classified according to age classes. Fragments of generated thematical products of MSU-SK image processing put on the left frame of this page.
We validated generated thematic products using forest inventory maps of Chunsky, Eniseisky, Kizirsky, and Motyginsky leskhozes. First, we digitized forest maps. Then, we referenced the maps to images and our products. As a base for referencing we used river confluence, road junctions, and forest contours with geometric shapes that were easy to recognize in images and forest maps. Final average accuracy of forest map and image referencing was approximately 210 m.
The control plots were selected in large forests and in different categories of forest and non-forest lands, so that we could compensate partially the influence of referencing errors of forest map and produce thematic images to validation accuracy. We compared control plots with the maps of forested and non-forested lands ("forest" and "non-forest") and found the following accuracy of thematic classes: 93% of pixels of forest control plots were classified as "forest" class, 83% of pixels of non-forest control plots were classified as "non-forest" class (see Table 1). First and second type errors for "forest" and "non-forest" classes were approximately 13% and 36%, correspondingly. This value of accuracy is high enough to permit using the MSU-SK data for reliable regional level forest maps.
Table 1 Confusion matrix of the classification result ("forest" and "non-forest" map) and control plots selected by forest inventory maps
| Control plots | Classes of "forest - non-forest" map | Pixels, totally | Relative amount of "misses" | ||
| ą | Classes | 1 | 2 | ||
| 1 | Forest | 23122 | 1670 | 24792 | 0.07 |
| 2 | Non-forest | 1501 | 7302 | 8803 | 0.17 |
| Pixels, totally | 30424 | 8972 | 33595 | - | |
| Relative amount of "false alarms" | 0.06 | 0.19 | - | - | |
Comparison of land category maps with control plots for correspondent classes permits the conclusions stated below (Table 2):
- Some categories of non-forest lands are easy to recognize: bogs (85%), clear cuts and old fire scars (79%), urbanized territories (93%);
- A percentage of "recent fire scars and dead stands" class confused with "dead stands damaged by insects" is high (27%). Spectral brightness of these classes is similar for all channels of MSU-SK sensor, which creates difficulties for their precise identification in satellite images and selection of unique base signatures.
- A high percentage of "agriculture lands" class is confused with "bogs" class (approximately 30%). We think that specifics of reflected spectrum of fields could explain this phenomenon. Spectrum of some crops and irrigated lands is close to those of sphagnum and hypnum grass bogs of the test region.
- 10% of pixels of "agricultural land" class was classified as "fresh fire scars and dead stands" class. A part of agricultural land belongs to ploughed fields with low reflectance brightness in red and near infrared parts of electromagnetic spectrum. Because of that they are similar to burned areas. This explanation also applies to the fact that 29% of pixels of "water" class were classified as "agricultural land" class.
- Class "clearings" was completely classified as "clear cuts and old fire scars" class. In forestry, "clearing" is an old clear-cut territory, which has not been reforested. We hypothesize that when we selected control plots of this class from forest inventory database, we retrieved obsolete information about this territory. More verification of these results is a necessary.
Table 2 Confusion matrix of the classification result (land categories map) and the control plots selected by forest inventory maps
| Control plot | Classes of land category map | Pixels, totally | Relative amount of "misses" | ||||||||
| ą | Classes | 1 | 2 | 3 | 4 | 5 | 6 | 7 | 8 | ||
| 1 | Bogs | 271 0 |
106 | 2 | 9 | 0 | 368 | 0 | 0 | 3195 | 0.15 |
| 2 | Clear cuts and old fire scars | 117 | 105 8 |
0 | 3 | 0 | 5 | 15 3 |
0 | 1336 | 0.21 |
| 3 | Resent fire scars and dead stands | 1 | 26 | 413 9 |
172 9 |
7 | 434 | 15 3 |
0 | 6489 | 0.36 |
| 4 | Damaged forests | 8 | 16 | 42 | 137 |
2 | 37 | 0 | 0 | 242 | 0.43 |
| 5 | Urban territories | 0 | 0 | 12 | 3 | 121 4 |
71 | 0 | 3 | 1303 | 0.07 |
| 6 | Agricultural lands | 175 9 |
760 | 639 | 31 | 128 | 263 7 |
4 | 0 | 5958 | 0.56 |
| 7 | Clearings | 26 | 106 | 0 | 0 | 0 | 1 | 0 | 0 | 133 | 1.00 |
| 8 | Water | 0 | 1 | 38 | 8 | 238 | 188 | 0 | 17 7 |
650 | 0.73 |
| Pixels, totally | 462 1 |
207 3 |
487 2 |
192 0 |
158 9 |
374 1 |
31 0 |
18 0 |
9306 | - | |
| Relative amount of "false alarms" | 0.4 1 |
0.49 |
0.15 |
0.93 |
0.24 |
0.3 | 1.0 0 |
0.0 2 |
- | - | |
- When validation had being processed, we had little information about forest density in test leskhozes of project region. This negatively affected validation of age classes recognition. These results also have to be verified again.
Comparative analysis of the map of main species groups and age classes and the data of forest inventory returned the following results (see Table 3):
- High percentage of deciduous (88%) and dark coniferous (92%) stands is correctly recognized from medium-resolution MSU-SK images. First and second type errors are not more than 6%. This as a positive indication that satellite data can be successfully applied to recognize these classes.
Table 3.Confusion matrix of the classification result (dominated species map) and the control plots selected by forest inventory maps
| Control plots | Classes of main species map | Pixels, totally |
Relative amount of "misses" |
||||
| ą | Classes | 1 | 2 | 3 | 4 | ||
| 1 | Deciduous forests | 78032 | 1333 | 6222 | 2666 | 88253 | 0.12 |
| 2 | Mixed forests | 878 | 2351 | 605 | 255 | 4089 | 0.42 |
| 3 | Light coniferous forests | 536 | 1734 | 13887 | 3848 | 20005 | 0.31 |
| 4 | Dark coniferous forests | 1098 | 492 | 1704 | 38955 | 42249 | 0.08 |
| Pixels, totally | 80544 | 5910 | 22418 | 45724 | 154596 | - | |
| Relative amount of "false alarms" | 0.03 | 0.60 | 0.38 | 0.15 | - | - | |
- Contrary to the expected, there was a high recognition error (31%) of light coniferous stands class. We explain this with errors made during base pixel identification on MSU-SK images, with subsequent distortions in spectral signatures of this class. This result should be verified, too.
- We think, that recognition accuracy of "mixed forests" class is quite acceptable (58%). This is a heterogeneous class with high dispersion of class brightness.
Table 4 lists probabilities of correct recognition of "young" and "mature" classes, for different groups of main species. It can be easily seen that the age classes map for deciduous species is quite accurate (average accuracy for all classes is 96,5%).
Table 4 Confusion matrix of the classification results and the control plots selected by forest inventory maps:
a) age groups of deciduous stands map
| Control plots | Classes of age category map of deciduous stands | Pixels, totally | Relative amount of "misses"" | ||
| ą | Classes | 1 | 2 | ||
| 1 | Young stands | 14574 | 476 | 24792 | 0.03 |
| 2 | Mature stands | 614 | 7718 | 8332 | 0.08 |
| Pixels, totally | 15188 | 8194 | 33595 | - | |
| Relative amount of "false alarms" | 0.04 | 0.06 | - | - | |
Comparative analysis of control plots with classes of age classes map of light conifers found significant errors of recognition of young light coniferous stands. We refer it to a small size of training sample. Therefore, base signature of this class is not statistically representative.
b) age groups of light coniferous stands map
| Control plots | Classes of age category map of light coniferous stands | Pixels, totally | Relative amount of "misses"" | ||
| ą | Classes | 1 | 2 | ||
| 1 | Young stands | 253 | 1129 | 1382 | 0.18 |
| 2 | Mature stands | 341 | 815 | 1156 | 0.3 |
| Pixels, totally | 595 | 1944 | 2538 | - | |
| Relative amount of "false alarms" | 0.57 | 0.42 | - | - | |
Average probability of correct recognition of age classes for dark conifers is 76%, which is acceptable. However, approximately 29% of pixels of mature stands of dark coniferous were recognized as "young stands" class. More thorough analysis of the control sample revealed that a majority of confused pixels belong to the class of middle age (41 - 90 years old) stands of dark conifers. This partially explains this type of classification error.
b) age groups of dark coniferous stands map
| Control plots | Classes of age category map of dark coniferous stands | Pixels, totally | Relative amount of "misses"" | ||
| ą | Classes | 1 | 2 | ||
| 1 | Young stands | 2995 | 824 | 3819 | 0.22 |
| 2 | Mature stands | 3052 | 7536 | 10588 | 0.29 |
| Pixels, totally | 6047 | 8360 | 14407 | - | |
| Relative amount of "false alarms" | 0.29 | 0.10 | - | - | |
Recommendations to application of RESOURS/MSU-SK data for regional scale forest mapping
Validation of cartographical products based on thematic processing of MSU-SK images permitted us to evaluate information available from this medium resolution scanner. Regarding application of RESURS/MSU-SK data for regional scale forest mapping, we formulated the following recommendations:
- It is possible to use images from MSU-SK scanner to generate regional maps of Russian forests and to monitor regional scale forest dynamics.
- An accuracy of land categories map, produced by classification of single MSU-SK images, is 71%. This is lower than accuracy of maps, produced by other investigators [10]. Further research is necessary to correct the methods used for thematic image processing and for verification of results. However, even at this project stage we can make some conclusions concerning the advantages of MSU-SK images used to produce land category maps of remote parts of Siberia and Far East. There are no up-to-date forestry data in these regions.
- Maps of main species, age classes of dark conifers, and age classes of light conifers have acceptable accuracy (77%, 76%, and 96.5%, correspondingly). We need more research to improve probability of correct recognition of mixed and light coniferous forests and to improve the processing methods of MSU-SK images.
- We need multi-seasonal MSU-SK images and special thematic processing methods to produce more detailed regional forest maps of main species (pine, birch, aspen, fir, etc.)
Our analysis of initial images revealed a number of problems that limit the field of application of medium resolution scanner MSU-SK of RESURS-O satellite.
- It is impossible to calibrate image pixels and to calculate the real parameters of reflected spectrum of sensed objects. This limits cooperative processing of images scanned with different perspectives of sun and observations;
- Noisy optical channel of existing MSU-SK scanner of RESURS-O1-3 satellite increases percentage of incorrect recognition of land categories with similar reflected spectrum;
- There is no accurate model of geometric correction for MSU-SK images. Therefore, one should use additional information about the territory being observed by a satellite. This information should include ground base points, which complicates development of automatic algorithms for producing cloud-free multi-seasonal composite images of large territories of Siberia and Far East.
Such complications still permit using the images from medium-resolution MSU-SK scanner of RESURS-O satellite to draft spatial distribution of Siberian and Far East forests at a regional level.