| MAIN |
| ABOUT A PROJECT |
| OBJECTIVES |
| TEST REGIONS |
| DATA BASES |
| STUDY RESULTS |
| REPORTS |
| CONTACTS |
Pic 1
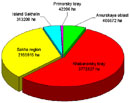
Distribution of burned areas by Far East regions
Distribution of burned areas by Far East regions
Pic 2
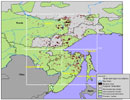
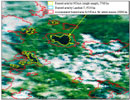
Example of burned area map of Far East in 1998 as result of AVHRR/NOAA images processing
Example of burned area map of Far East in 1998 as result of AVHRR/NOAA images processing
Pic 3
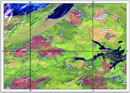
Fragment of LANDSAT-7 ( ETM+) imagery and results of interpretation of burned areas
Fragment of LANDSAT-7 ( ETM+) imagery and results of interpretation of burned areas
Pic 4
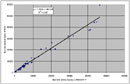
Regression relationship between the burned areas mapped using the satellite imagery of NOAA-AVHRR and LANDSAT ETM+
Regression relationship between the burned areas mapped using the satellite imagery of NOAA-AVHRR and LANDSAT ETM+
Pic 5
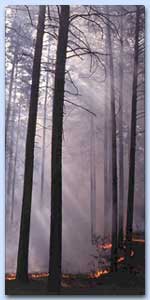
An example of fire detection by satellite imagery NOAA-AVHRR
An example of fire detection by satellite imagery NOAA-AVHRR
Pic 6
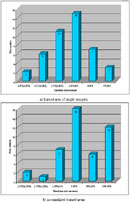
Histograms of errors of burned area assessment mapping during entire observation of test region by NOAA satellite. NOAA's burned areas are compared with Landsat-7 ones
Histograms of errors of burned area assessment mapping during entire observation of test region by NOAA satellite. NOAA's burned areas are compared with Landsat-7 ones
The algorithm of burned area mapping
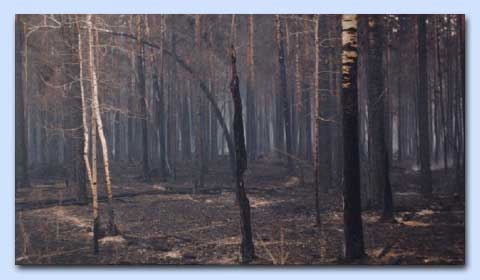
Mapping of burned areas of forests (based on NOAA images) is as important as detection of the active hot spots. The fire scar maps help to estimate the burned areas on large territories and to find the fire damage, using the medium and high-resolution satellite data (SPOT, LANDSAT, RESURS-O).
The algorithm of fire scars detection, developed in the International Forest Institute, employs an interactive approximation algorithm to find fire boundaries. The algorithm uses additional information describing the territory. The algorithm processes a single AVHRR/NOAA image. However, it also uses the hot spots data, resulted from the processing of the entire set of satellite images.
There are five main steps in the algorithm of AVHRR/NOAA image processing:
- Generation of theme image of the objects that can influence the statistics of the "potential burned area" class.
- Generation of a mask of potential burned areas.
- Initial step of mask correction - joint analysis of the layer of hot spots, found by the detection algorithm, and of the layer of potential burned areas.
- Second step of correction of the mask of potential burned areas. Adaptation of the thresholds of burned area recognition, done by an analysis of the layer of potential burned areas with the nearest pixels.
- Third step of correction of the mask of potential burned areas. Filtering of the burned areas with less than 15% of hot spots accumulated through the entire period and more than 10% of urbanized territories.
We separated the satellite images into the blocks (matrices) not larger than 50x50 km for cloudiness and 30x30 km for the analysis of potential burned areas. This allowed us to reduce the influence of many factors, such as BRDF, atmospheric interference, vegetation phenology, etc. The size of matrix was set in such a way, that is had enough statistical samples of the entire set of analyzed objects, e.g. clouds, cloud shades, water, burned areas, bare soil, forests undamaged by fire.
During the initial step, an iteration algorithm classifies the pixels of NOAA image into three classes: "clouds and smoke", "cloud shades and water", and "clear lands". The first iteration includes the following:
- Using the algorithm described in [6], which splintering the 3rd channel into two parts, black body radiance and reflected solar radiance, the "clouds and smoke" layer is generated. This class will be further referred to as a set of pixels {Cc};
- The shades are masked by clouds mask shift to the direction of the sun and to the distance calculated as the following:
DIST = H * tan(SZA).
Here H - conditional average cloudiness height (5 km), SZA - Sun zenith angle. This class will be further referred as a set of pixels {Csh}; - Water bodies are masked with the Digital Chart of the World (DCW). This class will be further referred as a set of pixels {Cw};
- The "clear lands" class is masked. The class includes all the pixels left out of the other classes. This class will be further referred as a set of {Ccc};
During the further iterations, the {Cńń} class is used as a base for the decision rule. The base class statistics is used to classify a pixel as belonging to one of the three classes. The iterations stop when the amount of pixels in the classes changes by less than 5% or when the total number of iterations is more than 3.
Experiment methodology
An experiment of registration of NOAA-AVHRR image pixels with the real fires included the following steps:
- Manual selection of cloud free images;
- Georeferencing of the selected images using satellite orbital parameters;
- Imagery processing and creating layer of hot spot and burned areas;
- Transformation hot spots and burned areas into map coverage and including into GIS.
The IFI and SRI RAS experts developed software for automatic processing of experimental data. The software algorithm was thoroughly described above.
Initial two steps were processed by software, designed for pre-processing of remote sensing information from NOAA satellites. Software allows to load and to look at the AVHRR remote sensing images, to georeference the images with orbital parameters, to correct radiometric information, and to export the images into data storage formats of the successive processing steps.
Then, the algorithms of hot spots detection, and burned area mapping processed the AVHRR images. The locations of hot spots and burned areas found by the algorithms are stored in text files. The text files with stored hot spots were imported into ARCVIEW shell and burned areas map layers were produced.
The integrated map layer included fire contours for the entire April - September 1998 period covered by remote sensing data of NOAA satellite. For each of the areas found, the following parameters were also stored: detection date and time, satellite revolution number, area of the burned site in ha and perimeter in km2. The GIS ARCVIEW 3.0 format was used to store the results of processing and for further analysis of map coverages.
Analysis of experiment results
We divided the test region into four equal parts to simplify processing and to reduce the size of processed images. We examined the algorithms during the initial part of our projects, using results of fire detection and mapping. Because of that, we were able to correct the algorithms and to estimate their accuracy.
Preprocessing of the archived AVHRR/NOAA satellite data already included geometry correction and correction of NOAA image georeferencing. This permitted us to include the entire archived set of 1998 satellite data into our analysis. Table 1 shows the results of hot spot detection and mapping. Our analysis found a total of 1112 of burned areas. In these areas, a total of 25227 hot spots have been located. The spatial distribution of fire areas found in the test region, for administrative units of the Russian Federation, is drafted in Figure 1. Figure 2 shows the general map of 1998 newly burned areas in the test region.
Table 1. Far East forest fire detection and mapping. A period of May to October, 1998 is covered.
| Square | Hot spots, pixel | Amount of burned areas | Area, ha |
| Top left | 7240 | 303 | 1599530 |
| Top right | 8993 | 298 | 2372992 |
| Bottom left | 1488 | 129 | 650662 |
| Bottom right | 7506 | 382 | 2236145 |
During manual analysis of detection results, some specific features of the designed approach were found and the experiment methods were corrected.
Firstly, the disqualified images created temporal brakes in active fire observations. This limited our resources to perform the continuous monitoring of fire progress and to compute the actual burned area. This problem is important for large forest fires, which were covered by clouds for a significant amount of time. Using the images, one can manually detect burned locations with much larger area than the total area of the hot spots.
Secondly, territories with a large amount of active fires burning at the same time can be considerably blackened with smoke. This results in changed values of albedo and of brightness temperature of hot spots that are manually recognizable in the images as an open fire. However, these pixels are not detected as hot spots, because their values do not satisfy the threshold conditions of the algorithm.
We made the following conclusion after we analyzed the results of hot spot detection and fire monitoring:
- Cloudiness cause temporal gaps in hot spot monitoring, which limits the possibilities of consistent fire monitoring and actual burned area computing.
- Detected hot spots can not provide enough information for correct computing of currently burning areas. The burned areas inside fire contour should also be analyzed.
- The existing image processing algorithm for detection of hot spots, covered with smoke, should be modified to permit fire detection in a territory covered by dense smoke.
We used these results to develop a mapping algorithm for burned areas.
The accuracy of the results of burned area mapping was examined with the high resolution Landsat-7 images. The images were selected from the EOSDIS (Earth Observation System Data Gateway) catalog. The contours of burned areas were manually selected in the images.
We selected the fires extinguished before the middle of September 1998. Additionally we used the archived fire data, extracted from the reports of aerial forest protection service "AVIALESOOKHRANA", and the results of hot spot detection from NOAA data.
We produced a control sample of 44 burned areas with a size of 150 to 50,000 ha from deciphered Landsat ETM+ images. Figure 3 shows a part of Landsat ETM+ image with decoded fire contours.
The control fire areas were compared with the processed NOAA images, covering the test region for the entire April to March period under research. A comparative analysis shows rather good correlation R2 = 0.97 of these data (see figure 4). For the scatter plot of fires, the angle of trend line is approximately 45 degrees. On the other hand, the trend line crosses the Y-coordinate with a shift equal to a constant term in regression equation: y = 1,034x + 691,05. At a first glance, this shows limitations of the fire detection and burned areas mapping algorithm. But the further analysis of data showed that when the fire coverage is generated by accumulation of fire contours, detected during the entire season, fire areas could be overestimated because of accumulated errors of satellite image georeferencing.
For example, some investigators shown that 0.2 pixel shift of images resulted in 10% error in calculated area. In our research, the georeference error was 1-2 pixels. Shifts in various directions result in considerably larger accumulated area when the fire contours from single images were integrated into one fire coverage of the map (figure 5). This accuracy of geo referencing heavily impacts computational error of the area of burned sites that are less than 100 ha. Hence, computational accuracy is reduced by 6 to 7 times. For the sites up to 500 ha, the accuracy is approximately 60%, up to 1000 ha - 40%, up to 5000 ha - 15%, and up to 10,000 ha - approximately 10%.
To compensate the errors of satellite image referencing, the algorithm used very high boundary levels that actually reduced the found areas of burned sites. It can be clearly seen in figure 6, which shows distribution histograms of the areas computed from the accumulated data and from single images, with 10% step. The histogram shows that in the accumulated data (figure 6a) areas of the majority of the burned sites (34 fires, i.e. approximately 77%) are overestimated. At the same time, only 23% of the burned sites (10 fires) have overestimated area when the single images are used (figure 6b). The other fires had smaller area, as compared to the Landsat ETM+ data.
Totally the areas of more than 70% of the control burned plots were computed with 10% or better accuracy, for both approaches. This level of accuracy is quite acceptable, when one considers the rather low resolution of AVHRR radiometer.
Concluding, the following researches were completed within the time of the project:
- Algorithms of hot spot detection and burned areas mapping were developed
- Set of AVHRR/NOAA satellite images for the territory of Far East was prepared, covering the period of April to September of 1998. The AVHRR/NOAA satellite images were corrected with georeference enhancing algorithms. The algorithms were based on recovering of the correlation between AVHRR images and water mask;
- Entire data set was processed and the 1998 mapping coverages of fires and recently burned areas were produced for the test region.
- We estimated data accuracy and made recommendations regarding applicability of the algorithms to mapping of current forest fires.
The accuracy of the algorithms of current forest fire mapping permitted us to make the following conclusions:
- Described experiments on fire detection and mapping allowed us to correct the algorithms so that they could be applied to the territories covered with dense smoke and to mitigate the seasonal change impact on radiance temperature of hot spots and adjacent objects.
- Applied algorithms of detection and mapping of current forest fires have 10% or better accuracy of computed area for approximately 70% of the entire amount of detected hot spots.
- The main source of area computing errors is imprecise referencing of AVHRR/NOAA images. We worked with the referencing error of 1 -2 pixels. Shifts in various directions resulted in considerably larger accumulated area when the fire contours from single images were integrated into one fire coverage of the map.
- Another reason of overestimated areas was probably the fact that for inspection we used the 1999 high-resolution data of Landsat ETM+ satellite, i.e. we used the test region fire data of the next year. After a year passed, only those burned sites with more than 70% of trees damaged could be detected reliably. The area of these after-burned sites was decreased because the vegetation of less damaged part could recover partially or non-forest vegetation could grow in the less damaged part. Forests damaged with ground or low-intensity fires could significantly change the spectrum of cover reflectance in a few months, and hence they would not be classified as a burned land any longer.