| MAIN |
| ABOUT A PROJECT |
| OBJECTIVES |
| TEST REGIONS |
| DATA BASES |
| STUDY RESULTS |
| REPORTS |
| CONTACTS |
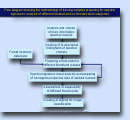
Flow diagram showing the methodology of training samples preparing for spectral signatures' analysis of different forested and un-forested land categories
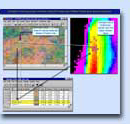
3 Illustration to training sample correction method for preparing of different forest lands spectral signatures
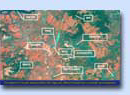
The fragment of middle resolution MSU-SK image with different forested and un-forested land categories
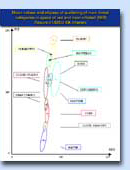
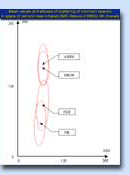
Mean values and ellipses of scattering of main forest categories in space of red and near-infrared (NIR) Resurs-O1/MSU-SK channels
Mean values and ellipses of scattering of dominant species in space of red and near-infrared (NIR) Resurs-O1/MSU-SK channels
Mean values and ellipses of scattering of age classes of different species in space of red and near-infrared (NIR) Resurs-O1/MSU-SK channels
RESEARCH METHODOLOGY
Study of spectral difference between different classes of forest objects was an important step of the research of forest mapping based on satellite image analysis. Spectral signatures of different classes of forest and non-forest classes were pre-processed at several steps. The sequence of these steps is illustrated by the scheme on Pic 1. An analysis of the amount of information in the 3rd and 4th spectral channels of MSU-SK image was the first step. A reason for that was a similar wavelength spectrum for these channels and, consequently, significant correlation of the correspondent images. We used a principal component method, which allowed us not only to reduce the dimension of spectral channels, but also to assess a share of energy of each of these channels.
As a result, it was found that the principle component has 87% of the energy and the second component has 13%. This shows that the first channel contains all usable information about dispersion (variation). The analysis of energy of the 3rd and 4th channels in the principle component shows some advantage of the fourth channel (52%) over the third one (48%). This is why we considered the 4th channel within the significant ones during the separability analysis of different classes of land, covered or not covered with forest. Two-dimensional histograms were drawn for the selected channels. These histograms further, when we performed a selection of sample plots, allowed us to manually assess the homogeneity of spectral signatures of classes.
Basing on the project goals, on structure and contents of the Usolsky leskhos database of forest taxation data, and on a priori hypothesis about the most important factors that influence the form of spectral signatures, the following trends of study were chosen:
- Study of spectral signatures of main categories of forest and non-forest lands;
- Study of spectral signatures of forest stands with different main species and different age classes.
To reduce an impact of these factors, we refined the standard samples by masking of their brightness values into two-dimensional spectral channel histogram. Then, we manually selected a compact set of brightness values near the class median value (Pic 2).
Within the study of spectral signatures, for each homogeneous group of forest objects we computed brightness average and dispersion of each of the four MSU-SK channel images and divergence. This allowed us to estimate separability of pairs of classes under analysis.
RESULTS
For a study of spectral signatures, following classes of forest and non-forest land on the current step of the project: highly closed stands, clear cuts, burned areas, the stands destroyed by insects, hayfields, pastures, urbanized territories, forest openings, bogs, and water bodies.
Table 1
Brightness average and standard deviation for main categories of non-forest land, not covered with forest land, and covered with forests land, using the MSU-SK/Resurs-O1 images.
|
Land category |
Sample volume |
Channel 1 |
Channel 2 |
Channel 3 |
Channel 4 |
||||
|
M(x)* |
D(x)* |
M(x) |
D(x) |
M(x) |
D(x) |
M(x) |
D(x) |
||
|
high-closed stands |
7271 |
35.425 |
2.086 |
27.984 |
1.099 |
51.366 |
7.334 |
55.989 |
8.022 |
|
clear cuts |
597 |
37.243 |
2.059 |
31.345 |
1.749 |
63.663 |
6.074 |
69.911 |
6.338 |
|
burned areas |
90 |
35.000 |
1.635 |
28.533 |
0.950 |
37.400 |
4.829 |
40.422 |
5.262 |
|
the stands destroyed by insects |
487 |
34.772 |
1.735 |
27.844 |
1.068 |
40.162 |
4.363 |
44.037 |
4.633 |
|
hayfields |
198 |
36.320 |
2.265 |
29.475 |
1.349 |
61.330 |
3.850 |
67.396 |
3.100 |
|
pastures |
117 |
36.129 |
2.126 |
29.080 |
1.130 |
52.921 |
3.377 |
57.829 |
2.525 |
|
urbanized territories |
125 |
39.072 |
2.290 |
33.032 |
2.335 |
53.336 |
8.572 |
58.008 |
8.875 |
|
forest openings |
137 |
38.438 |
2.284 |
31.787 |
1.569 |
70.912 |
4.108 |
77.968 |
2.378 |
|
bogs |
288 |
36.768 |
2.191 |
30.017 |
1.207 |
52.795 |
3.938 |
57.617 |
3.423 |
|
water bodies |
2492 |
35.904 |
2.035 |
26.694 |
1.613 |
26.521 |
5.257 |
26.805 |
5.833 |
· M(x) - average and D(x) - standard deviation of a class.
Pic 3 shows a part of composite MSU-SK image with the areas of different land categories, covered and not covered with forests.
Table 1 lists data of brightness average and standard deviation of the categories of forest land, for each of the four MSK-SK channel images.
A class of highly closed stands includes all the species of all ages, found on the test area, if a dominant specie totals more than 70% and has density more than 0.7.
Table 2 lists values of divergence, and scatter diagrams in Pic 4 show the brightness of main categories of forest lands. These diagrams permit a quantitative separability assessment of the forest land categories, which is based on the distance between the channels, measured in a space of spectral features, and on the level of deviation.
From the analysis of bi-dimensional diagrams and the values of divergence, one can make the following conclusions about the level of recognition of different classes of forest objects using the values of spectral brightness of MSU-SK images:
- The highly closed stands and clear cuts are rather well recognized objects in the images, in spite of the significant heterogeneity of species, age, and grow conditions of the forest stands as well as different clear cut age;
- A significant confusion between bogs and pastures and between hayfields and clear cuts has been noticed;
- Contrary to what was expected, a bad separation of such forest land categories as scars and areas destroyed by silkworm has been noticed.
Values of divergence for the pairs of main forest land categories.
|
Class name |
ą |
1 |
2 |
3 |
4 |
5 |
6 |
7 |
8 |
9 |
10 |
|
Highly closed stands |
1 |
0.00 |
|||||||||
|
clear cuts |
2 |
0.87 |
0.00 |
||||||||
|
scars |
3 |
0.99 |
1.00 |
0.00 |
|||||||
|
the stands destroyed by insects |
4 |
0.75 |
1.00 |
0.36 |
0.00 |
||||||
|
hayfields |
5 |
0.98 |
0.41 |
1.00 |
1.00 |
0.00 |
|
|
|
|
|
|
pastures |
6 |
0.95 |
0.98 |
1.00 |
0.99 |
0.93 |
0.00 |
|
|
|
|
|
urbanized territories |
7 |
0.99 |
0.82 |
1.00 |
0.99 |
0.94 |
0.86 |
0.00 |
|||
|
forest openings |
8 |
0.99 |
0.83 |
1.00 |
1.00 |
0.96 |
1.00 |
1.00 |
0.00 |
||
|
bogs |
9 |
0.93 |
0.95 |
1.00 |
0.99 |
0.93 |
0.12 |
0.72 |
1.00 |
0.00 |
|
|
water bodies |
10 |
1.00 |
1.00 |
1.00 |
1.00 |
0.99 |
1.00 |
1.00 |
1.00 |
1.00 |
0.00 |
For a study of spectral signatures of natural forest stands with different main species and ages we selected natural forest stands with the following main forest species: pine, fir, birch, and aspen. We excluded from our research stands of spruce, cedar, and larch because their samplings were not statistically representative. We also had an identification problem with healthy fir stands because of their massive destruction during Siberian silkworm outbreak of 1994-1997. To eliminate this problem, we additionally used the healthy fir stands data from other leskhoses of Angara river region.
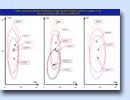
Absolute values of stand ages were grouped into 5 classes using a standard scale of ages, adopted in Russia (table 3). Pic 5 shows scatter image brightness diagrams for channels 2 and 4, for classes of stands of different species.
Pic 6 shows scatter image brightness diagrams for channels 2 and 4, for classes of stands of different age groups and of different main species. This picture illustrates that it is quite possible to recognize coniferous when the dominant species are pine and fir, and deciduous and coniferous stands. To separate birch from aspen one has to include spectral properties that depend from phenological variations of deciduous species stands.
Table 3
Age class distribution of coniferous and deciduous forest stands.
|
Forest stands |
Minor and young |
Young |
Middle age |
Premature |
Mature and overmature |
|
Class 1 |
Class 2 |
Class 3 |
Class 4 |
Class 5 |
|
|
deciduous |
Younger than 10 years |
11 - 20 |
21 - 50 |
51 - 80 |
Older than 81 |
|
coniferous |
Younger than 20 years |
21 - 40 |
41 - 90 |
91 - 140 |
Older than 140 |
These charts show that the mentioned above spectrum specifics depends on stand age for such species as pine and birch. The lack of similarly significant dependency for aspen and fir stands can be explained by significantly fewer amounts of stands with these species in the test region. The former leads to smaller sampling representation. Table 4 presents the data of sampling volume, brightness average and standard deviation of the images of these stand classes, as found using the channels of Resurs-O1/MSU-SK satellite.
Table 4
Brightness average and standard deviation of the images of forest stands of different forest forming species and of different age, as found using the data from MSU-SK.
|
Land category |
Sample volume |
Channel 1 |
Channel 2 |
Channel 3 |
Channel 4 |
||||
|
M(x) |
D(x) |
M(x) |
D(x) |
M(x) |
D(x) |
M(x) |
D(x) |
||
|
Birch, class 3 |
1461 |
35.322 |
1.981 |
27.871 |
0.918 |
60.697 |
3.095 |
66.778 |
2.203 |
|
Birch, class 4 |
1845 |
35.587 |
2.046 |
28.346 |
1.009 |
59.010 |
3.553 |
64.767 |
2.684 |
|
Birch, class 5 |
1549 |
35.572 |
2.034 |
28.308 |
0.970 |
57.554 |
3.644 |
63.093 |
2.690 |
|
Aspen, class 2 |
168 |
35.473 |
2.014 |
28.106 |
0.859 |
60.222 |
4.087 |
66.291 |
3.796 |
|
Aspen, class 3 |
199 |
35.636 |
2.047 |
28.478 |
0.862 |
61.188 |
3.557 |
67.438 |
3.016 |
|
Aspen, class 4 |
120 |
35.389 |
1.990 |
27.977 |
0.894 |
59.964 |
3.773 |
66.017 |
3.383 |
|
Aspen, class 5 |
107 |
35.494 |
1.990 |
28.241 |
0.736 |
58.073 |
3.863 |
63.693 |
3.133 |
|
Fir, class 5 |
1648 |
34.163 |
2.034 |
26.235 |
1.040 |
40.555 |
2.443 |
43.522 |
1.780 |
|
Pine, class 1 |
1463 |
35.667 |
2.042 |
28.271 |
0.923 |
51.460 |
3.920 |
56.117 |
3.510 |
|
Pine, class 2 |
1410 |
35.734 |
2.049 |
28.340 |
0.921 |
48.810 |
3.659 |
53.000 |
3.268 |
|
Pine, class 3 |
2421 |
35.536 |
2.018 |
28.061 |
0.759 |
49.494 |
3.988 |
53.834 |
3.690 |
|
Pine, class 4 |
954 |
35.222 |
2.144 |
27.649 |
1.205 |
44.823 |
3.279 |
48.420 |
2.755 |
|
Pine, class 5 |
1526 |
35.314 |
2.156 |
27.780 |
1.247 |
44.791 |
3.186 |
48.362 |
2.650 |
Table 5 gives the values of divergence. These values allow to estimate a possibility to separate the different age stands of pine, birch, and aspen, using the spectrum specifics.
The table data analysis and the analysis of the diagrams in Pic 5show good separation of pine stands into the young and old groups of age. The highest rate of confusion is taken place when we recognize images of middle and premature age classes. The divergence increase with increasing stand age difference seems to be quite logical. The analysis of divergence, done with the images of birch stands, has similarly shown that the criterion depends on stand age. However one can not make a reliable separation analysis between young and old stands because of insufficient sample of young stands.
Table 5
Values of divergence for main species forest stands of different age classes.
|
Specie, age of stand |
|
1 |
2 |
3 |
4 |
5 |
6 |
7 |
8 |
9 |
10 |
11 |
12 |
13 |
|
Pine, class 1 |
1 |
0 |
|
|
|
|
|
|
|
|
|
|
|
|
|
Pine, class 2 |
2 |
0.22 |
0 |
|
|
|
|
|
|
|
|
|
|
|
|
Pine, class 3 |
3 |
0.25 |
0.05 |
0 |
|
|
|
|
|
|
|
|
|
|
|
Pine, class 4 |
4 |
0.84 |
0.51 |
0.61 |
0 |
|
|
|
|
|
|
|
|
|
|
Pine, class 5 |
5 |
0.85 |
0.52 |
0.63 |
0.01 |
0 |
|
|
|
|
|
|
|
|
|
Birch, class 3 |
6 |
0.97 |
1.00 |
0.99 |
1.00 |
1.00 |
0 |
|
|
|
|
|
|
|
|
Birch, class 4 |
7 |
0.88 |
0.98 |
0.96 |
1.00 |
1.00 |
0.16 |
0 |
|
|
|
|
|
|
|
Birch, class 5 |
8 |
0.75 |
0.95 |
0.91 |
1.00 |
1.00 |
0.40 |
0.08 |
0 |
|
|
|
|
|
|
Aspen, class 2 |
9 |
0.91 |
0.99 |
0.97 |
1.00 |
1.00 |
0.09 |
0.11 |
0.28 |
0 |
|
|
|
|
|
Aspen, class 3 |
10 |
0.96 |
1.00 |
0.99 |
1.00 |
1.00 |
0.10 |
0.19 |
0.42 |
0.07 |
0 |
|
|
|
|
Aspen, class 4 |
11 |
0.90 |
0.98 |
0.97 |
1.00 |
1.00 |
0.07 |
0.08 |
0.24 |
0.02 |
0.02 |
0 |
|
|
|
Aspen, class 5 |
12 |
0.77 |
0.95 |
0.92 |
1.00 |
1.00 |
0.31 |
0.06 |
0.04 |
0.18 |
0.18 |
1.14 |
0 |
|
|
Fir, class 5 |
13 |
1.00 |
0.99 |
0.99 |
0.74 |
0.75 |
1.00 |
1.00 |
1.00 |
1.00 |
1.00 |
1.00 |
1.00 |
0 |
We can not analyze a possibility to recognize the age groups of aspen stands because of insufficient sample of young stands.
There is also a good level of separability between the mature fir stands and mixed stands of pine, birch, and aspen of different ages.
As a result, our interim period research gave us the following preliminary conclusions about spectral separability of different classes of forest lands:
- The research of spectral signatures of main categories of forest and non-forest land shows good spectral separability of the images of closed forest areas from the images of bogs, clear cuts, hayfields, pastures, scars, and forests destroyed from insects outbreak.
- A significant confusion between such categories of not covered with forests land, as scars and the stands, destroyed by silkworm was noticed.
- A confusion between clear cuts and hayfields was noticed
- The research of stand age influence on spectral signatures of stand images, received from Resurs-O1/MSU-SK satellite, showed a rather steady tendency of image brightness change with the age of pine and birch stands. However, only two groups can be reliably recognized- young and mature stands.
- The test site does not have enough data on spruce, fir, and larch. Therefore, an additional information from other leskhoses and an additional study of separability of these stand classes is necessary.